Running a Go Debugger in Kubernetes

Marvin Beckers

October 8, 2023

Categorized as container and debugging

(Note: This blog post is a written version of my talk Ephemeral Containers in Action - Running a Go Debugger in Kubernetes. Slides and recordings are available in the linked repository.)

Identifying bugs in our code can be hard; really hard. In complex microservice environments, it can be even harder, since reproducing the exact request flow which triggered a bug can be quite the challenge. Thankfully the modern observability stack can be quite helpful in the matter.

But sometimes extended observability might not be available or it’s still not enough to identify the problematic code path. In those cases I like to break out a proper debugger, set specific breakpoints and investigate the program’s state at those breakpoints.

But how do we run a debugger within Kubernetes, where our application actually lives? We do not want to run our application with active debugging all the time! Not a problem (anymore)! We can utilize ephemeral containers. It will allow us to launch a debugger into an existing Pod on demand.

Before going into the details, let’s review what debugging actually is and what considerations we need to be aware of when debugging Go applications.

Basics of debugging (Go)

Debugging is a long-standing staple of software development. If it is not part of our development toolbox yet, it might be worth looking into it. print based debugging sometimes has lower friction, but knowing how to use a debugger is a powerful skill.

For Go, the go-to debugger is, without a doubt, Delve. Delve is a debugger specific to Go and has been around for years. While using GBD is possible, the official Go documentation recommends using Delve when possible. For some basics of debugging Go applications with Delve, there is an article available from golang.cafe that serves as a good introduction.

The gist however is that debuggers allow to inspect application state during code execution. We can set breakpoints and look at variable contents when that breakpoint is hit. In Go, specifically, it is also possible to inspect Goroutines.

This means debuggers are incredibly powerful in identifying faults in code since the whole state can be inspected at any given time. Once set up, effective debugger usage beats print-style debugging by a mile or two.

Let’s take a look at the requirements to run a debugger.

Linux capabilities

While interacting with the operating system, we often interact with kernel APIs. For this article we will take a quick look at the Linux kernel in specific, but similar concepts probably exist in the operating system of our choice. They do not overlap 100%, but they are probably close enough.

In Linux, there is a concept called capabilities. Capabilities are assigned to a process and allow to interact with certain functionality of the kernel. This enables more granular permissions than running a process as a super user.

For debuggers, a specific capability is usually required - CAP_SYS_PTRACE - because it unlocks calling the ptrace system call. Debuggers need this to attach to running processes and to interact with their memory and registers. It essentially allows us to “take control” of an already running process.

That is a scary-looking system call and there is good reason this is locked by a capability. But we need it! As a Linux user, we might not see this level of detail (and maybe run the debugger via sudo) but since we are thinking of running a debugger in Kubernetes, we need to be aware of this. A container in Kubernetes does not have this capability by default. Let’s keep this in mind, it will come up later again.

Go compile flags

Debuggers usually require a certain level of information encoded in the binary that they try to debug. This means that the “production” build of our application binary might not be suitable for debugging.

To determine this, we can look at how our binaries are built, e.g. in a Makefile or Dockerfile. If the following flags are present in go build’s -ldflags we definitely need a separate debug build:

  • -s: Omit the symbol table and debug information.
  • -w: Omit the DWARF symbol table.

Both flags allow us to optimize the binary size at the expense of debug information, which is usually what we want for production builds. If this is the case, a separate image needs to be provided that does not have those flags set. Otherwise, the application cannot be debugged. This also means that we will need to launch a separate application Pod with the debug-enabled application build. More on that later.

In addition, some flags can be helpful for debugging. Since we rely on line numbers to set breakpoints, we need to make sure that our code is not optimized by the compiler. This can happen if the compiler recognizes code patterns that can be simplified. Some parts of the code might therefore be changed and cause issues with debugging, although optimized code is generally considered okay (with some pitfalls).

Code optimization can be disabled if required by passing additional flags:

$ go build -gcflags="all=-N -l"

This will pass two flags to the Go compiler for all invocations. The flags being

  • -N: Disable optimizations.
  • -l: Disable inlining.

We should be careful with these flags though, since the compiler usually has some pretty good ideas about optimizing code. Let’s only add them if debugging gives us unexpected results or errors when trying to set breakpoints.

Remote debugging

Now we have established debugging as a concept - But so far, we have been talking about attaching ourselves to processes on the system. Which obviously means that we need to be on the same (virtual) machine. But if the application is running within Kubernetes, it would be nice to be able to debug from the comfort of our laptop.

Thankfully, the Debug Adapter Protocol exists to help us out. Developed for Visual Studio Code to have a standardized protocol to interact with so-called debug adapters (intermediate layers that translate between a client and the actual debugger), it has seen solid adoption and will help us out here (even if we do not use VS Code).

Debug Adapter Protocol Flow

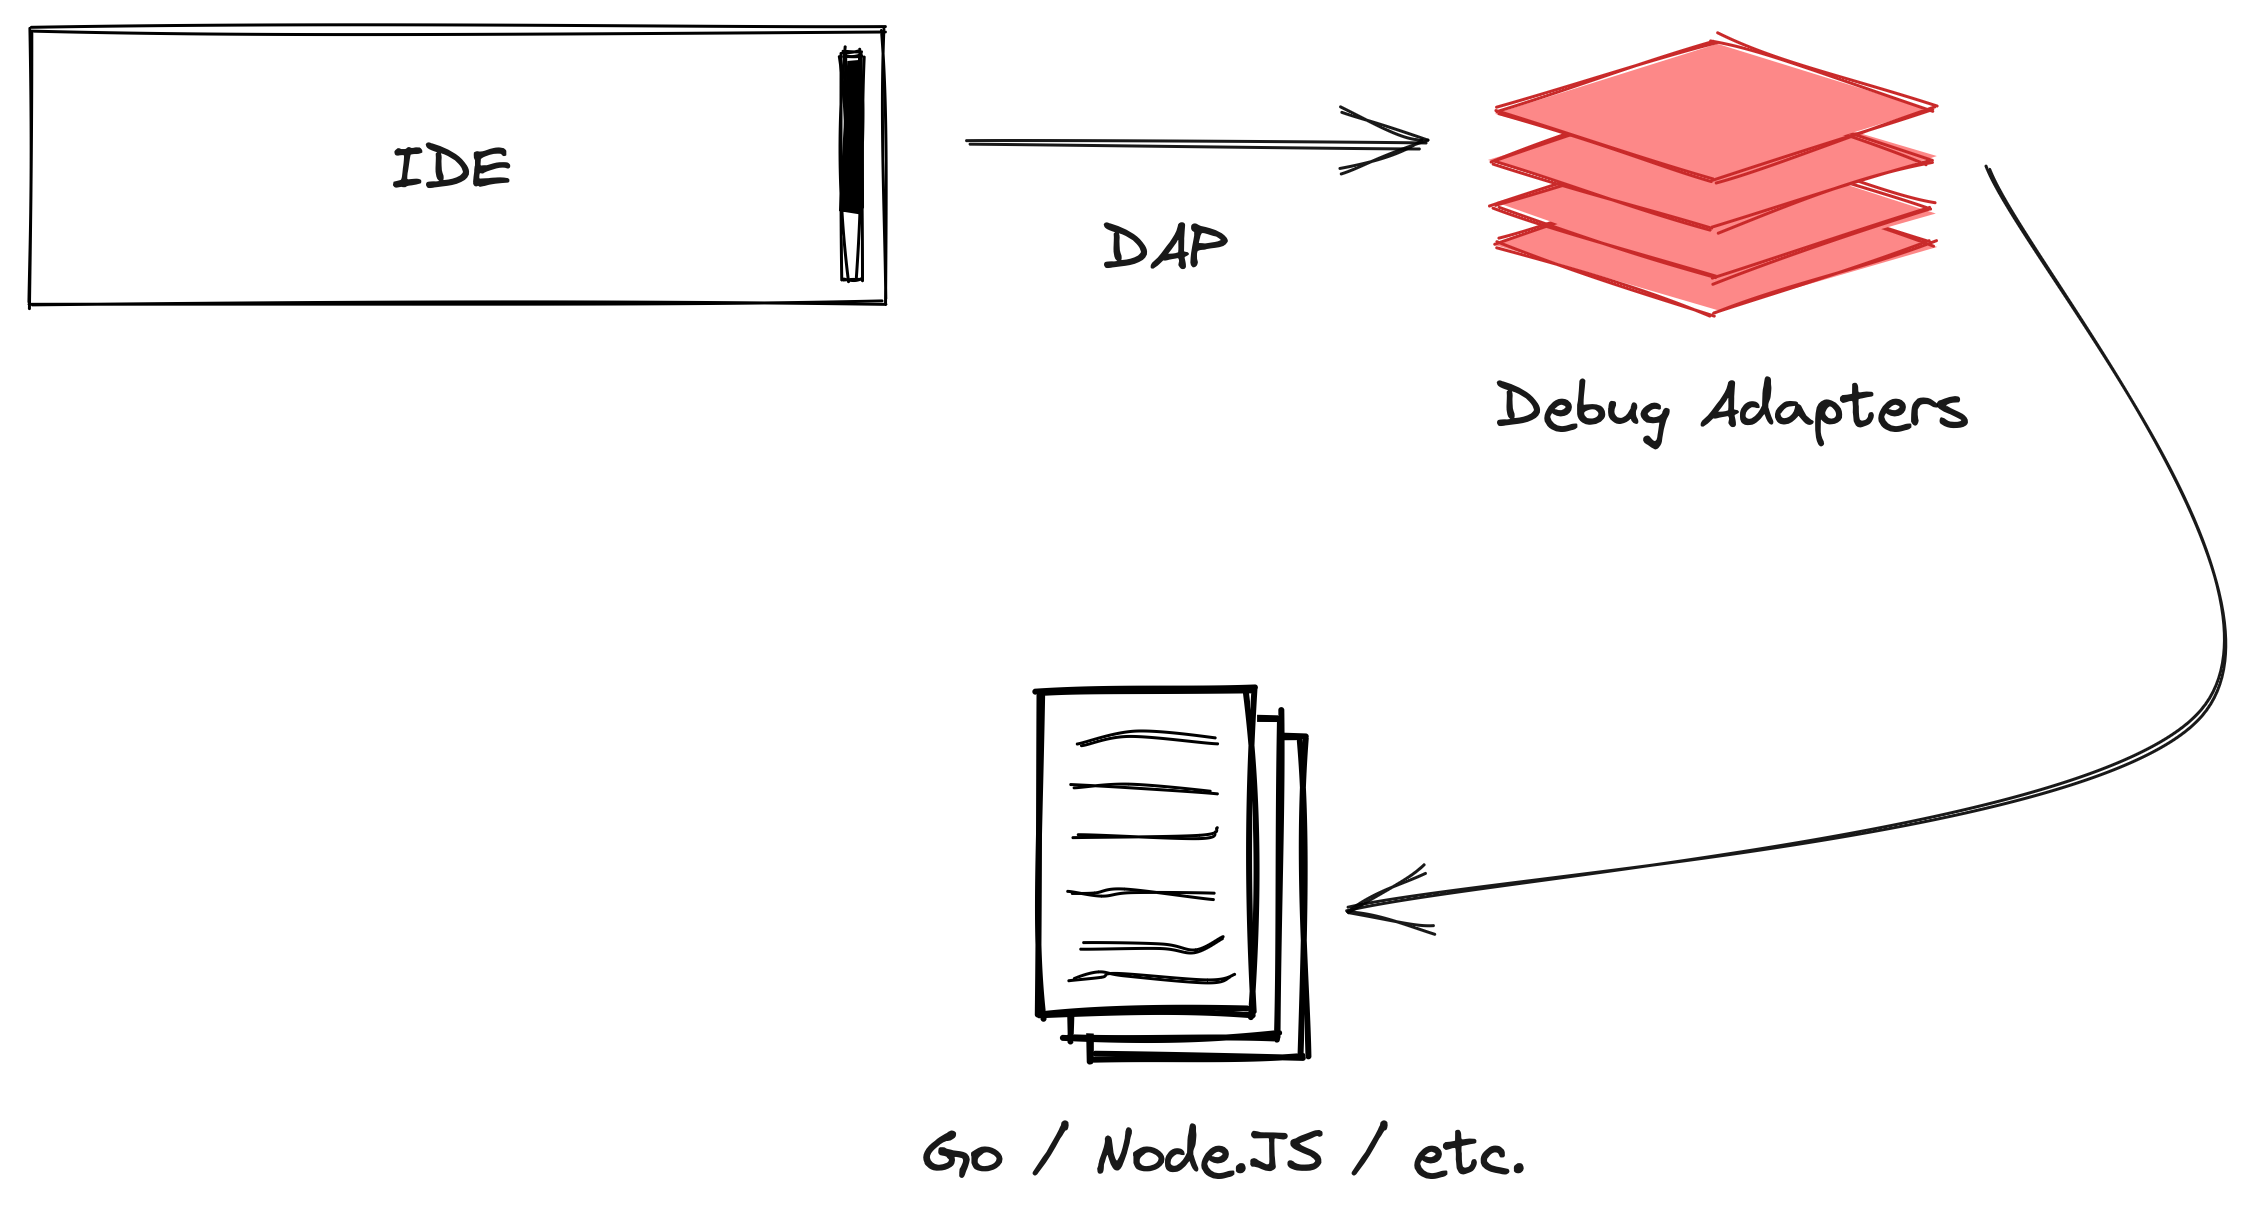
While DAP was meant to enable debug adapters as a layer in between, its success has triggered adoption in debuggers directly, overshooting the stated project goal. Delve has a native DAP implementation and can act as a DAP server. It also has its own protocol implementation that stems from before DAP adoption and can serve both protocols as a server. We will focus on DAP for this blog post since it is a (somewhat) new and emerging standard. For adaption into other language stacks, the Delve protocol is not interesting at all.

The interesting bit about DAP (and Delve’s own protocol) is that it is networked. This means we can suddenly traverse network boundaries when starting a debugging session! We can launch a debugging session on the system running the application (i.e. in Kubernetes) and then connect to it via a remote client (i.e. our local system).

Delve Remote Debugging

We will use that to our advantage, since we prefer integrating debug sessions with our usual development tools. But to do so, we need an active debugger to connect to. Next, we will take a look at how to get the debugger (with a DAP server onboard) into Kubernetes in the first place.

A primer on ephemeral containers

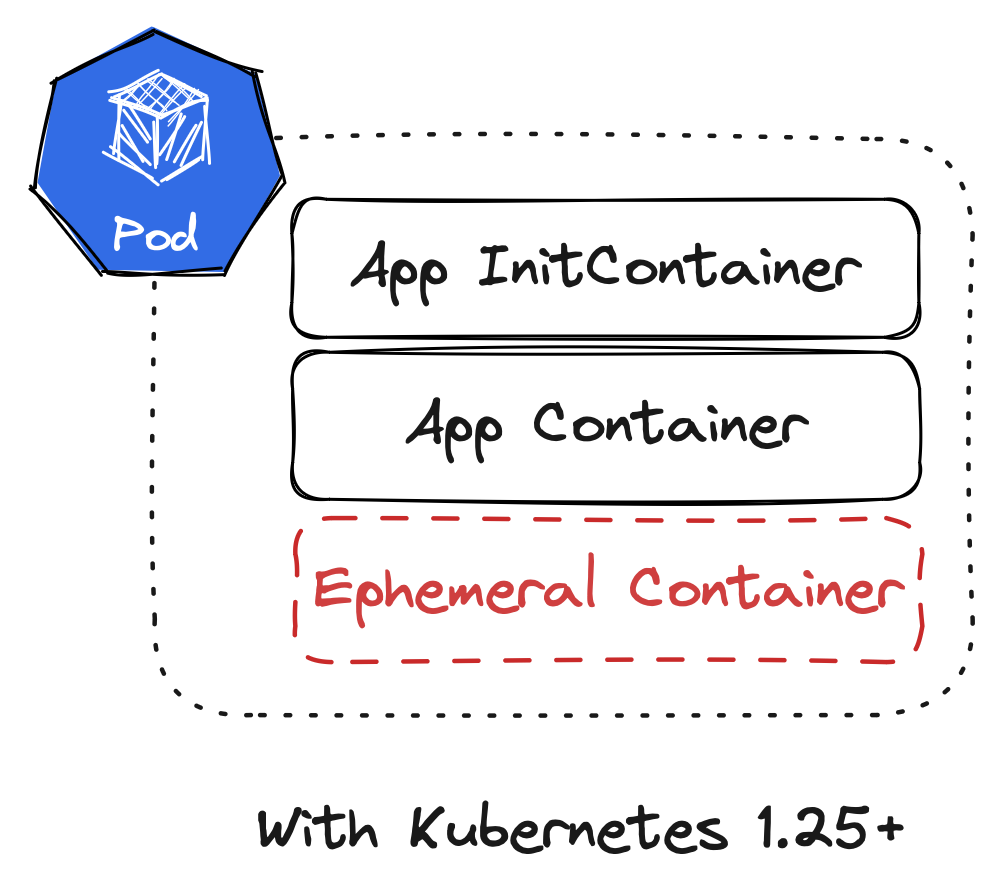
Ephemeral containers are a feature in Kubernetes that became generally available in Kubernetes 1.25. Before ephemeral containers, there were two types of containers in a Pod specification: InitContainers and (normal) containers. InitContainers run before the “normal” containers at Pod startup to execute some initialisation logic (note this is also changing with sidecar patterns available in InitContainers). But both types of containers needed to be defined in the Pod specification when creating the Pod. Pods were more or less immutable, we could not change them once they were created.

Container Types in Pods Before Kubernetes 1.25

This changes with ephemeral containers! Ephemeral containers are part of the Pod specification but are implemented as a subresource. And most importantly the list of ephemeral containers can be amended while the Pod is running. In fact, we can only create ephemeral containers while the Pod is running since subresources cannot be created at the same time as the actual resource.

Container Types in Pods After Kubernetes 1.25

Command line tooling

Since we established that we will need some special tooling to interact with the ephemeralContainers subresource on a Pod, let’s look at our options.

The obvious candidate is kubectl. Thankfully, it got us covered! kubectl debug is available as a command in the kubectl (kube-control? kube-cuttle? kube-c-t-l?) toolbox. It allows us to launch ephemeral containers into specific Pods.

$ kubectl debug <pod> -it --image=busybox --target=<container>

With the example above, an ephemeral container using the busybox image (--image) is attached to the specified Pod <pod>. It also connects the ephemeral container to a specific <container> (--target), which means that we break down the isolation between containers so the ephemeral container can access the process namespace of the target one. We also tell kubectl debug to drop us into an interactive shell in the ephemeral container (-i and -t).

kubectl debug is a very powerful toolbox for debugging in Kubernetes! If we choose to provide a special build of our application image (as discussed earlier), we cannot debug a “live” Pod. But we can use --copy-to and --set-image to

  1. create a new Pod from the “template” of a currently running Pod and
  2. override the image used for the application container to a debug-enabled image

which could be used to run a variant of this debug workflow against a Pod copy.

Debugging profiles

As established earlier, a debugger needs CAP_SYS_PTRACE (essentially by definition). By default a container does not have this capability, and for good reason!

But kubectl debug comes with a flag called --profile that helps with setting the right security configuration on the ephemeral container. This is a fairly recent addition, so not all use cases might be covered and it’s not always easy to figure out what a profile exactly provides, but for us, it is sufficient.

What we need is --profile=general, since it provides CAP_SYS_PTRACE and nothing more. Easy peasy.

As a minor side note: When I started working on this topic not everything was as polished as it is today. Because profiles were not yet available in kubectl debug, I had to develop my own little kubectl plugin called kubectl-ephemeral. It allows usage of the full API for the EphemeralContainer type to create ephemeral containers, which might prove useful if no profile provides the necessary configuration. Usually, we want kubectl debug though.

Delve as ephemeral container

Now we have everything that we need in building blocks. Let’s put it together! In this case, I am debugging a sample application that is a simple Go web server. It is already running in Kubernetes. We now want to create an ephemeral container in one of the Pods for that application. The ephemeral container should start Delve, attach to the application, and open a DAP server port.

$ kubectl debug \
    --profile=general \
    --target=sample-app \
    --image=quay.io/embik/dlv:v1.20.1 \
    sample-app-[...] \
    -- dlv --listen=127.0.0.1:2345 --headless=true attach 1

There we go. We attach to process id 1 because that is the process which started in the target container. Since we are connected to the PID namespace of the target container, we can just target the initial process - This only works if our target container does not have another entrypoint than the application binary.

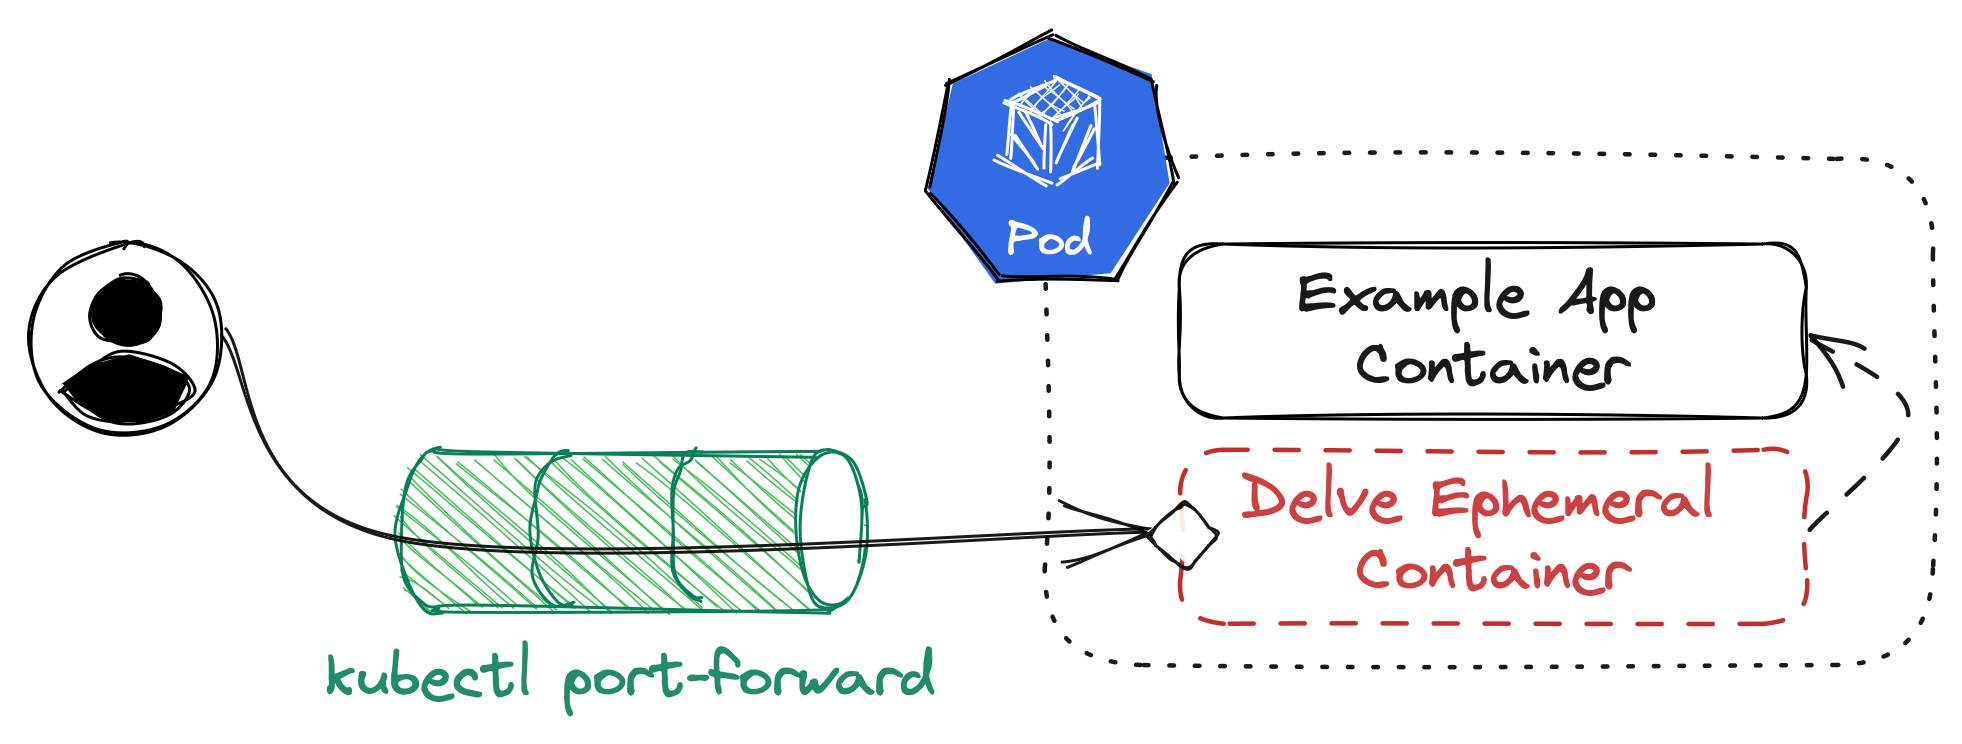
One last thing though: We opened the DAP server on 127.0.0.1:2345. That’s not accessible from outside the Pod! How are we supposed to connect our client to that? And how do we keep this port secured as DAP knows no authentication?

Thankfully, kubectl port-forward helps us close that last gap. It does not need a port definition in our PodSpec, it works ad-hoc. Which means we can simply run

$ kubectl port-forward pod/sample-app-[...] 2345

which opens port 2345 on our local system and forwards it to the port within our Pod that has Delve running. This is our setup visualized:

Full Setup Overview

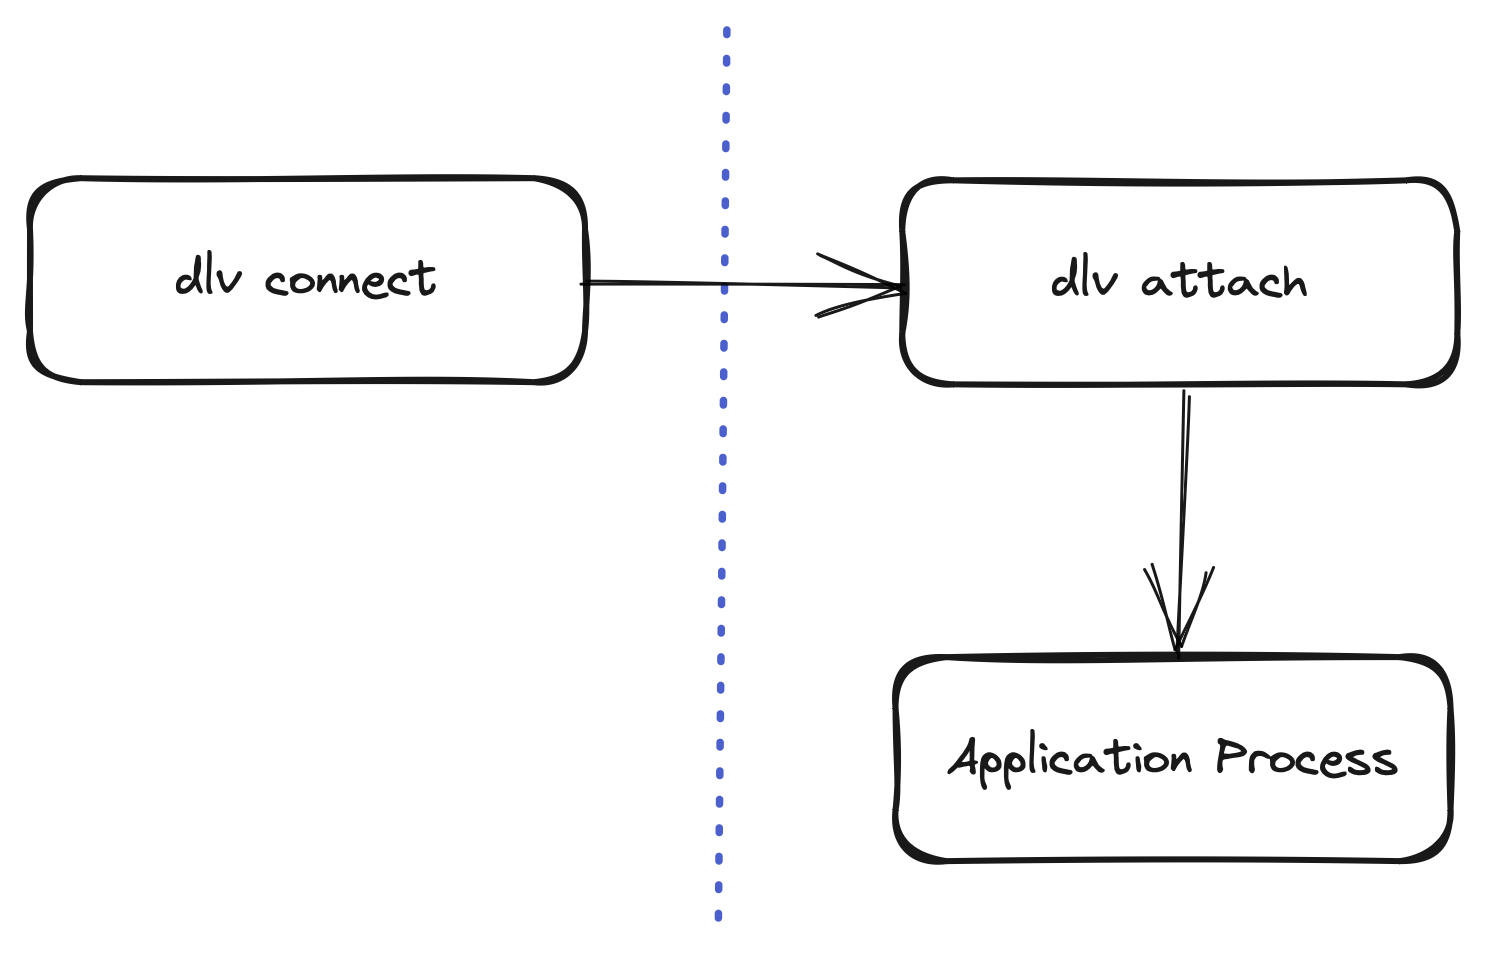
To validate that our setup is running, try connecting to the local port with dlv connect:

$ dlv connect localhost:2345

If everything is working, this will connect us to the remote instance of Delve running in Kubernetes. From here, we can use the interactive shell of dlv to start debugging!

But we started out with the promise of integration into our workflows - And while the command line might be part of our usual workflow in developing software, we can do better than that.

Remote debugging with VS Code

Since we have a working connection to the Delve headless server instance in our ephemeral container now, we can use a DAP client of our choice to connect to it. The most popular DAP client - by a mile or two, probably - is Visual Studio Code (VS Code). It also happens to be one of the more popular editors out there.

To configure VS Code to talk to Delve, we can drop a launch.json configuration file into the .vscode directory of our project (if the folder does not exist, we need to create it). VS Code will read it as a project-specific debugging configuration.

This - or something similar - is the file for my example project:

{
  "version": "0.2.0",
  "configurations": [
    {
      "name": "Remote Attach",
      "type": "go",
      "request": "attach",
      "debugAdapter": "dlv-dap",
      "mode": "remote",
      "substitutePath": [
        { "from": "${workspaceFolder}", "to": "/build" }
      ],
      "port": 2345,
      "host": "127.0.0.1"
	}
  ]
}

All of this is important to configure the connection to a running debugger, but we care mostly about type being set to "go" (since we are debugging Go code), debugAdapter set to "dlv-dap" (so VS Code knows it will talk to Delve via DAP), port and host referencing the local port-forwarding we have opened, and - most importantly - substitutePath set correctly.

Because Go embeds the full path in its debugging information (unless we trim paths), we need to tell VS Code about the original path that the binary was built in. In our case, this might have been /build, the working directory set in our Dockerfile. Therefore, we instruct VS Code to rewrite path information when interacting with the debugger from our current workspace folder to /build.

Once this is done, VS Code will offer the new debugging mode called Remote Attach from its debugging screen via the green play button. For a detailed overview of debugging capabilities in VS Code please check out the official documentation.

Closing thoughts

Phew, that was a lot. Hopefully this overview helps with designing a personal debugging workflow in Kubernetes. This was not meant as a step by step tutorial, but more of a showcasing for what ephemeral containers can do. Maybe it can serve as basis for additional, similar workflows.

I think it is clear from the full text that this is not an outright recommendation. A lot of preconditions need to be taken into consideration before a debugging session in Kubernetes will work. If they can be fulfilled, Delve can really help with figuring out deeply rooted bugs in an application.

Thank you to my personal editor for reviewing and improving this post!

Private DNS with CoreDNS, Podman and Ansible

Marvin Beckers

August 12, 2020

Categorized as linux

Running a private DNS resolver is useful in quite a few situations, for example in a home lab or on an internal company network; basically everywhere where you want to give names to private systems. CoreDNS is a simple DNS server that can be used in such a situation - if the name rings a bell with you, it’s because CoreDNS is the standard in-cluster DNS solution for Kubernetes for some time now. In practice, this means that large microservice architectures rely on it to resolve internal and external hostnames.

I decided to go with CoreDNS for my setup because of that fact (it’s a tool proved to be battle-tested in Kubernetes environments I worked with) and the simplicity of configuration - it needs a single configuration file, called Corefile, that defines the DNS resolver’s behavior. Moreover, CoreDNS is based on a plugin architecture, which potentially allows to extend it with custom functionality.

The small network that required a private DNS resolver in my case was however too small to run Kubernetes, so it was necessary to find a different way of running it. Since it is a Go program, downloading and running a binary would probably work - But I wanted to run it in a container for better isolation. CentOS 8 added support for a new container runtime largely spearheaded by Red Hat and Fedora called podman. podman is interesting because it gets rid of the omniscient (Docker) daemon, allowing for running containers in a more stand-alone manner. It also supports running containers as non-root users, albeit we won’t use this feature for now.

To deploy CoreDNS and maintain its configuration, I chose Ansible. Again, mostly because I worked with it before and because all I need to get started is a SSH key on the target system. The following steps will assume that you already have a running CentOS 8 system (likely a VM) running somewhere in your private network and that you have access to it. I won’t go into the basics of Ansible and I recommend you to search for tutorials / getting started guides on it before tagging along.

At the end of this, we will have a private DNS resolver that is capable of resolving public names (with some filtering in place) and resolving one or more private domains we can adjust to our needs.

Important: You should make sure that port 53 (DNS) of your system is not available on the public internet, securing access with firewall or security group rules.

Required packages

Depending on the disk/CD image you used to install CentOS 8, not all required tools will be available right away. Besides the container runtime we want to use (podman), let’s install two more packages: udica and bind-utils. bind-utils is just useful as it contains the dig command, something we can use to query our DNS resolver later on.

udica is more interesting: It hasn’t been mentioned yet, but I would like to integrate with existing security mechanisms on CentOS as much as possible. This means that we will keep SELinux in enforcing mode. udica will enable us to generate SELinux modules that will allow running CoreDNS in a podman container while keeping SELinux up.

All things considered, translated to a task in Ansible this would mean adding this to your coredns role:

- name: install base packages
  dnf:
    name:
      - podman
      - udica
      - bind-utils
    state: present

Later on, I will not present tasks for trivial operations in Ansible - I strongly recommend to adapt my findings to your needs.

Setting up a Corefile

Before we get too much into the details of deploying CoreDNS in podman, we should focus on defining our requirements for the DNS resolver and templating a Corefile around that.

We need to ensure that on the target system, there is a directory we can put our configuration into. My Ansible role creates /etc/coredns for that purpose:

- name: add directory for CoreDNS configuration
  file:
    path: /etc/coredns
    state: directory
    mode: '0755'

The bad news first: CoreDNS does not come with any kind of built in ad block solution. A lot of people are running services like Pi-hole on their private network and our solution won’t get as sophisticated as that. The good news is, if you want to block nepharious websites in your DNS resolver, you can still do that. Earlier we defined the requirement for our resolver to resolve all kinds of names, so let’s look into public names first.

Resolve public DNS, with a blocklist

To implement some kind of blocklist for bad DNS names, we can use the hosts plugin of CoreDNS. It reads the content of a /etc/hosts-style file and serves requests based on that. I have included a list from StevenBlack/hosts as a blocklist that will resolve the hosts on that list to 0.0.0.0, thus failing resolution. Download one of the lists (depending on what you would like to block) into your Ansible role and copy them to your target system.

Let’s set up the part in our Corefile that will allow our resolver to resolve public names with the restrictions of our blocklist in place. To do so, we can ask CoreDNS to look into our blocklist and fallthrough to the next lookup method if a name is not on our naughty list. We will rely on /etc/resolv.conf for upstream DNS, but you can adjust the forward plugin configuration we are including to suit your network situation.

. {
    hosts /etc/coredns/blocklist.hosts {
        fallthrough
    }
    forward . /etc/resolv.conf
    log
}

This short configuration snippet instructs CoreDNS in the following ways:

  • It defines a server block for ., which is the root zone, meaning that any requests should go through this configuration.
  • It uses the hosts plugin to try resolving a name from /etc/coredns/blocklist.hosts (our blocklist). If a name is not on that list, it will go to the next method of resolving the name.
  • It forwards any further requests to the DNS servers defined in /etc/resolv.conf.
  • It enables logging of all incoming requests via the log plugin.

Resolve private DNS

Now that we cover public DNS, let’s look into setting up one or more private DNS domains on this resolver. I am using the hosts plugin again to resolve a templated list of DNS names; you can adjust that to your needs and situation.

First, let’s generate another /etc/hosts-style file for our private zone. The minimal viable solution for this would be this Jinja2 template:

{% for entry in coredns_entries %}
{{ entry.ip }}  {{ entry.host }}
{% endfor %}

This requires passing the host variable coredns_entries to our target host in Ansible - A simple coredns_entries configuration could look like this (let’s throw in a variable for our private DNS zone for good measure):

coredns_internal_domain: privatezone.internal
coredns_entries:
    - ip: 10.0.0.1
      host: gateway.privatezone.internal
    - ip: 10.0.0.2
      host: gitlab.privatezone.internal

You can get smarter with this (e.g. using the coredns_internal_domain variable to eliminate the requirement for adding a fqdn each time), but this is the bare minimum that will get us started. If it’s possible, consider pulling this kind of information out of your inventory. Ansible should template this to the target system, e.g. into /etc/coredns/internal.hosts. Afterwards, adjust the Corefile (that should become a template at this point) to load our internal hosts file:

{{ coredns_internal_domain }} {
    hosts /etc/coredns/internal.hosts
    log
}

. {
    hosts /etc/coredns/blocklist.hosts {
        fallthrough
    }
    forward . /etc/resolv.conf
    log
}

There we go! It’s important to load your private zones before the big catch-all . block, so CoreDNS won’t try to send your private hostnames to public DNS resolvers. Now we have a minimal Corefile on our target system. Let’s look into running CoreDNS as a podman container next.

Running CoreDNS in Podman

The next thing we want to do is figuring out the correct podman command we want to run to start our CoreDNS container. While there is an equivalent to docker-compose available, let’s stay with the (mostly docker-compatible) podman cli. We will later wrap this call in systemd to leverage it as supervisor for our container.

The full podman run call that I came up with is this one:

/usr/bin/podman run --name coredns --read-only -p 10.0.0.1:53:53/tcp -p 10.0.0.1:53:53/udp -v /etc/coredns:/etc/coredns:ro --cap-drop ALL --cap-add NET_BIND_SERVICE coredns/coredns:1.7.0 -conf /etc/coredns/Corefile

Let’s look at the parameters passed here to understand what is going on:

  • --name coredns will set the container name to “coredns”. This means that running another instance of this command will conflict with any running or stopped one.
  • --read-only sets the container’s root filesystem to read-only mode. The root filesystem of a container is transient, so applications should not store any important data there anyway. CoreDNS doesn’t need write access to its root filesystem, so let’s disable this to improve isolation.
  • -p 10.0.0.1:53:53/tcp and -p 10.0.0.1:53:53/udp bind to port 53 on both TCP and UDP for the private IP the system; replace this with your own system’s private IP (or rather, use Jinja templating for it; we will follow up on that). Binding to the IP might be necessary because systemd-resolved is possibly taking the port on localhost, making it impossible to bind to.
  • -v /etc/coredns:/etc/coredns:ro mounts our configuration folder into the container. Again, this is read-only, to ensure integrity of our configuration files. CoreDNS has no need to write back into this directory.
  • --cap-drop ALL and --cap-add NET_BIND_SERVICE will drop as much Linux capabilities as possible while maintaining NET_BIND_SERVICE, which is required to bind to the port. Again, this improves isolation and is considered good practice to reduce attack surfaces.

All in all, this tries to limit the application running in the container in what it is capable of doing.

Now, if you try to run this command, it will hopefully fail - CoreDNS will be unable to bind to port 53 (if it does not fail or complain in the logs, you probably disabled SELinux previously - shame on you!). SELinux does not allow it yet. Let’s fix that.

Generating a SELinux policy

Remember when we installed udica in the beginning? Now its time to shine has come! udica is a small but awesome tool that allows generating SELinux policies from container definitions. It takes away a lot of pain with containers and active SELinux. With that being said, I urge you to read up on SELinux and how it works, giving you the opportunity to further slim down policies if possible.

Let’s pull the definition of our “coredns” container, put it into a JSON file and pass it to udica:

$ podman inspect coredns > container.json
$ udica -j container.json coredns

Policy coredns created!

Please load these modules using: 
# semodule -i coredns.cil /usr/share/udica/templates/{base_container.cil,net_container.cil}

Restart the container with: "--security-opt label=type:coredns.process" parameter

This generates a coredns.cil file in the current directory. For me, it looked like this:

(block coredns
    (blockinherit container)
    (blockinherit restricted_net_container)
    (allow process process ( capability ( net_bind_service )))

    (allow process dns_port_t ( tcp_socket (  name_bind )))
    (allow process dns_port_t ( udp_socket (  name_bind )))
    (allow process etc_t ( dir ( getattr search open read lock ioctl )))
    (allow process etc_t ( file ( getattr read ioctl lock open  )))
    (allow process etc_t ( sock_file ( getattr read open  )))
)

It’s relatively small and quite declarative, so the main takeaways from this policy should be:

  • it will allow using the net_bind_service capability.
  • it will allow the process to bind to ports labeled dns_port_t for UDP and TCP (which is only port 53).
  • it will allow the process to read from directories labeled etc_t (which is /etc, where our CoreDNS configuration directory is).

You could further lock down this policy with your own SELinux labels on /etc/coredns, but for now, this should suffice. It will get us past SELinux as a gatekeeper and improve our security posture because we didn’t disable SELinux (yay). To enable this policy, run the command in the udica output.

Interlude: SELinux policies and Ansible

As all configuration steps, this should be included in our Ansible role to make the installation reproducible on fresh systems. Unfortunately, Ansible doesn’t seem to offer a module that will allow applying this, which means we need to fall back to using the shell module. This is how my role handles applying this:

# tasks/main.yml
[...]
- name: create /etc/udica for custom SELinux policies
  file:
    path: /etc/udica
    state: directory
    mode: '0755'

- name: create coredns SELinux policy file
  copy:
    src: files/coredns.cil
    dest: /etc/udica/coredns.cil
  notify:
    - load coredns SELinux module
[...]

# handlers/main.yml
- name: load coredns SELinux module
  shell: 'semodule -i /etc/udica/coredns.cil /usr/share/udica/templates/{base_container.cil,net_container.cil}'

This creates a handler running semodule which is being called upon changes to the SELinux policy file.

systemd service

We’re almost done! At this point, our CoreDNS container should run successfully and you should be able to resolve hosts with dig @10.0.0.1 google.com (replace 10.0.0.1 with your own private IP) as long as you’re running the podman command from earlier.

But as mentioned, podman doesn’t come with a supervising daemon - Which means that no one will restart the container once it’s dead (for whatever reason); Nor will it be restarted upon reboot.

To fix this, let’s use something on our system that is already working as a supervisor to services: systemd! Fortunately, integration with systemd works quite well under podman, as long as you follow a template recommended by Red Hat.

This is the Jinja template that I use to generate /etc/systemd/system/coredns.service, which is based on the service unit template linked above. The main difference to a standard systemd service unit is that podman will write to PID files that systemd will read to be informed about the container status.

[Unit]
Description=CoreDNS private DNS in a container

[Service]
Restart=on-failure
ExecStartPre=/usr/bin/rm -f /%t/%n-pid /%t/%n-cid
ExecStartPre=-/usr/bin/podman rm -f coredns
ExecStart=/usr/bin/podman run --name coredns --read-only --security-opt label=type:coredns.process -p {{ ansible_eth1.ipv4.address }}:53:53/tcp -p {{ ansible_eth1.ipv4.address }}:53:53/udp -v /etc/coredns:/etc/coredns:ro --cap-drop ALL --cap-add NET_BIND_SERVICE --conmon-pidfile /%t/%n-pid --cidfile /%t/%n-cid -d coredns/coredns:1.7.0 -conf /etc/coredns/Corefile
ExecStop=/usr/bin/podman stop coredns
KillMode=none
Type=forking
PIDFile=/%t/%n-pid

[Install]
WantedBy=multi-user.target

Beyond what the template requires, note the additions in comparison to the previous iteration:

  • --security-opt label=type:coredns.process will allow the container to use our previously created SELinux policy.
  • -p {{ ansible_eth1.ipv4.address }}:53:53/tcp and -p {{ ansible_eth1.ipv4.address }}:53:53/udp will template in the private IP of my system, which is associated with eth1. Adjust to your situation.

This will deliver a fully functional systemd unit called coredns.service that will utilise podman and a targeted SELinux policy to run CoreDNS on your local network. Do not forget to write your Ansible role in a way that changes to the SELinux policy or your configuration files will trigger a restart.

Wrapping up

That’s it - We now have CoreDNS running, safely wrapped into podman, SELinux and systemd. Using Ansible is a nice bonus, allowing us to deploy our private DNS resolver to additional systems with little overhead. Not all steps have been presented as Ansible snippets, but I hope it will prove useful to those writing better roles than I do.

If everything worked well, we will now see a container running in podman:

$ podman ps
CONTAINER ID  IMAGE                            COMMAND               CREATED       STATUS           PORTS                                         NAMES
16f66c7140ed  docker.io/coredns/coredns:1.7.0  -conf /etc/coredn...  2 hours ago  Up 2 hours ago  10.0.0.1:53->53/tcp, 10.0.0.1:53->53/udp  coredns

To access the logs (which includes all requests the server received and answered), we can run podman logs coredns.

This setup obviously has further room for improvement. Next steps to explore could be (but are not limited to):

  • Pull the hostnames of our private dns zone out of the Ansible inventory during templating.
  • Use the cache plugin in CoreDNS to improve performance and reduce the need to reach out to upstream DNS resolvers.
  • Investigate other CoreDNS plugins for host discovery, exploring the possibilities of Corefile configuration.
  • Expose metrics via the prometheus plugin. This would require running a Prometheus server somewhere on your internal network, but improving visibility on your services is worthwhile.
  • Look into implementing a health check via podman to catch any service malfunction that might not result in the container crashing.