Kubernetes Homelab #1: Raspberry Pi Setup

Marvin Beckers

May 9, 2024

Categorized as kubernetes and homelab

I like to tinker with Kubernetes in my free time and I’ve always wanted to host some services for myself. Vaultwarden is one of those services since I’d like my passwords to be stored away where I can see them. Up to now this was running on an old Intel NUC that I stashed away in my apartment.

Years ago I had been using Raspberry Pis (generation 1 or 2, maybe?) for hosting some fun projects (e.g. a TV antenna receiver attached to a Raspberry Pi to watch TV – when that was still a thing).


This post is part of a blog post series describing my Kubernetes Homelab.


Now I wanted to try again because cloud is expensive, Kubernetes can be quite fun and I hadn’t tinkered with hardware in a good while. So my goal was to get a setup that

  1. had three nodes to make sure Kubernetes made sense. A single node isn’t really a cluster.
  2. provided its own storage. A NAS is expensive and a single point of failure, so “hyperconverged” (is that word still in use at all? it was the big hype in on-premise hardware ten years ago) was the way to go.
  3. didn’t boot from an SD card. Maybe this is fine now but I had many corrupted SD cards I needed to reformat back in the days. I wanted my machines to boot from a disk.
  4. used power over ethernet (PoE) to reduce the cables needed for powering the setup.
  5. allowed to expose services to me as its only user with valid TLS certificates and hostnames.

The blog post series that this post kicks off will map out my journey with getting my homelab up and running and document any steps and problems along the way.

Note: All commands in this post are executed as root. You can either prepend them with sudo or open a root shell once with sudo -i.

Hardware

The core of the setup is comprised of three Raspberry Pi 5 B with a 2.44 GHz ARM Cortex-A76 Quad-Core-CPU and 8GB of RAM. These machines are barely comparable to the original Raspberry Pi. They are quite the workhorses!

To power the Raspberry Pis over ethernet via PoE I bought a TP Link TL-SG1005P (a 5-port gigabit desktop PoE+ switch).

I ended up using the following HATs for the three Raspberry Pi 5 B, bought from Amazon:

Waveshare is a Chinese manufacturer of electronic components for microcontrollers and embedded boards. The choices for Raspberry Pi 5 PoE HATs is quite limited at the moment. An official PoE HAT had been announced, but updates have been rare and search results mostly end on a post half a year old. Jeff Geerling reviewed this PoE HAT (see his blog and the GitHub issue) and overall it looked promising.

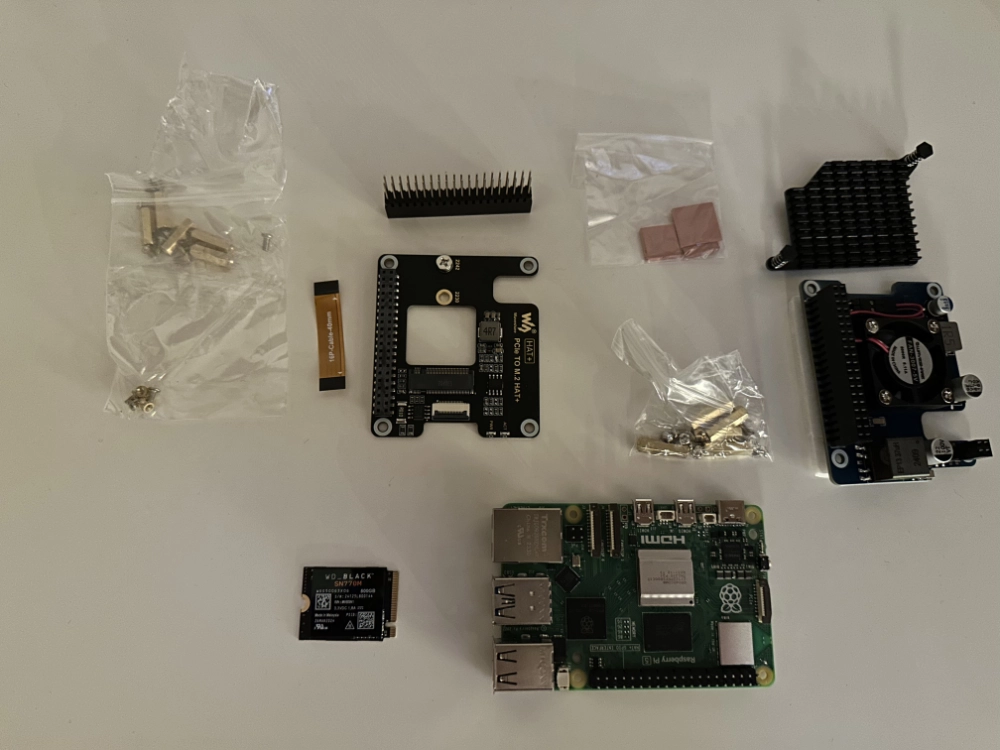
Raspberry Pi 5 and both HATs.

M.2 SSD

I went with Waveshare’s PCIe to M.2 HAT+ to make sure the two HATs would work with each other. However it seems to be hit or miss whether an M.2 SSD is going to be supported by the HAT or not. I started the setup with a Transcend TS256GMTS430S (a 256GB M.2 SSD), but the disk would not get recognized, even after following all troubleshooting steps. After some back and forth with Waveshare support I got the recommendation to use a Western Digital WD BLACK SN770M, which worked like a charm.

As is often the case with these kind of manufacturers, documentation is sparse. It was more or less impossible to figure out why the Transcend SSD wasn’t recognized – some sources were talking about the Raspberry Pi PCIe not working with a specific on-board controller on M.2 SSDs, but as far as my Google research suggested this SSD didn’t seem to be using that controller. In the end things worked out by exchanging hardware, thus it doesn’t seem a good idea to combine this particular HAT with Transcend M.2 SSDs.

Assembly

Overall assembly worked fine but required some careful strength applied at the right times. I assembled the system with the PoE HAT being attached to the Pi first as the lower layer and then added the PCIe to M.2 HAT on top of it.

Beware: It's possible to mount the heat sink coming with the PoE HAT the wrong way (either there are no markings or I missed them) and it's really not built to be removed to remount it. So make sure you mount it the right way (the longer edge should be on the side of the SD card slot), otherwise you won't be able to attach the PoE HAT.

The cable provided with the PCIe to M.2 HAT to connect the Pi’s PCIe slot to the HAT was just long enough to work in this stacked setup. Connecting it properly on both ends was a bit fiddly (especially on the Pi side – the HAT side has a very solid mechanism to hold the cable in place), tweezers came in very handy.

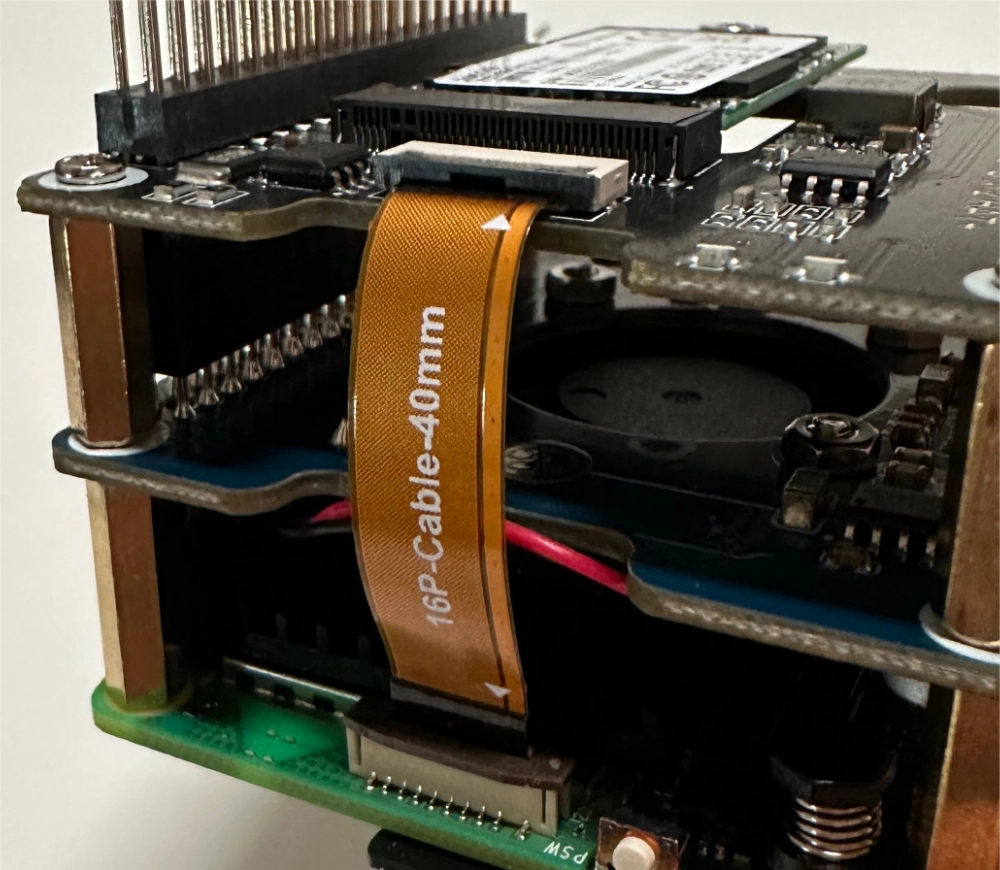
Cable to connect PCIe slot to M.2 HAT (with the non-functional SSD mounted).

System setup

The best choice of OS on the Raspberry Pi currently seems to be Raspberry Pi OS. It’s based on Debian, which is great because KubeOne (disclaimer: I’m a contributor to it and it’s developed by my employer, Kubermatic) has (limited) support for creating Kubernetes clusters on it.

Before booting from the M.2 SSD a quick detour via a bootable USB stick was needed. I used the Raspberry Pi Imager to write the latest Raspbbery Pi OS “lite” (no desktop environment included) to a spare 32GB USB stick. One of the important customizations here is enabling SSH and adding a SSH public key.

Plugging in the USB stick and powering on the Raspberry Pi by connecting the ethernet cable started Raspberry Pi OS from the USB stick. I used this transient setup to check on the M.2 SSD disk and prepare it to become the boot device. To find its IP address I signed into my home router’s web UI, found the newly connected device and made sure to configure the device to always receive the same IP address from the router’s DHCP server.

Setting up static IPs here is actually pretty important for the Kubernetes setup later. Kubernetes doesn't really expect nodes to change IP addresses, and all three of my Pis are going to be control plane nodes; this "rule" applies especially to the control plane and might otherwise result in breaking the cluster.

After connecting via SSH I had to make sure the M.2 SSD was actually working. That required configuration so that the Raspberry Pi would start with NVMe support which can be added by editing /boot/firmware/config.txt and adding the following line:

dtparam=nvme

On one of the Pis also refused to boot from NVMe (in one of the later steps) before updating its firmware. To do so I ran the following commands (still booting from the USB stick):

$ apt update
$ apt upgrade
$ rpi-update

For this and the dtparam addition to take effect a reboot is required. Afterwards, the SSD showed up as block device:

$ lsblk
NAME        MAJ:MIN RM   SIZE RO TYPE MOUNTPOINTS
sda           8:0    1  28.7G  0 disk
|-sda1        8:1    1   512M  0 part /boot/firmware
`-sda2        8:2    1  28.2G  0 part /
nvme0n1     259:0    0 465.8G  0 disk

At this point the SSD was showing up so I was able to prepare it to become the system’s boot disk. First of all I needed a Raspberry Pi OS (64bit) lite image on the system:

$ curl -O https://downloads.raspberrypi.com/raspios_lite_arm64/images/raspios_lite_arm64-2024-03-15/2024-03-15-raspios-bookworm-arm64-lite.img.xz
$ unxz 2024-03-15-raspios-bookworm-arm64-lite.img.xz

Next step was writing the image to disk:

$ dd if=./2024-03-15-raspios-bookworm-arm64-lite.img of=/dev/nvme0n1

This resulted in a partition table on /dev/nvme0n1 so the output of lsblk changed:

$ lsblk
[...]
nvme0n1     259:0    0 465.8G  0 disk
|-nvme0n1p1 259:1    0   512M  0 part
`-nvme0n1p2 259:2    0   2.1G  0 part

OS modifications

The OS written to disk did not include modifications to access after booting it. I skipped the Raspberry Pi image writer this time and did the modification in a chroot environment:

$ mount /dev/nvme0n1p2 /mnt
$ mount /dev/nvme0n1p1 /mnt/boot
$ chroot /mnt

The /boot/config.txt file in this environment also required dtparam=nvme since it was separate from the file (on the USB stick environment) previously adjusted.

Next up was changing the hostname:

$ echo "rpi-01" > /etc/hostname

To make sure that DNS resolution for its own name was working properly a slight modification to /etc/hosts and ensuring that the entry for 127.0.1.1 included the new hostname was necessary:

127.0.1.1		rpi-01 raspberrypi

For access to the system after boot I configured the existing user pi to have my SSH key. In addition /boot/ssh tells the OS to start sshd on boot.

$ mkdir -p /home/pi/.ssh
$ echo "ssh-ed25519 AAAA[...] embik" > /home/pi/.ssh/authorized_keys
$ chown -R /home/pi/.ssh pi:pi
$ touch /boot/ssh

I wanted to rename the pi user to embik on first boot by setting /boot/userconf.txt. Unfortunately you always need to pass a hashed password which can be generated by openssl passwd -6. Part of the post-boot steps was going to be removing the set password anyway.

$ echo "embik:$6$..." > /boot/userconf.txt

Everything on the NVMe disk was ready, so the only thing left there was to leave the chroot environment and make sure the disk was cleanly unmounted.

$ exit
$ umount /mnt/boot
$ umount /mnt

Boot from NVMe

Last step was changing the boot order to make sure the next time the Raspberry Pi started, it would boot from my M.2 SSD.

$ rpi-eeprom-config --edit

I changed BOOT_ORDER to 0xf416 which attempts boot from NVMe and falls back in case the NVMe disk isn’t bootable. In addition this configuration needed PCIE_PROBE=1. Now everything is set and ready to reboot the system into the M.2 SSD.

A curious observation from my first setup was that while 0xf416 should describe the boot order “NVMe -> SD card -> USB stick” (see Raspberry Pi documentation), my Pi would not successfully boot from the still inserted SD card when my NVMe disk wasn’t formatted properly. I had to use an USB stick to recover the system.

Post-boot steps

Once rebooted, ssh became available after a couple of seconds (booting from the M.2 SSD makes it essentially another system, so ssh-keygen -R was necessary before being able to connect). The system indeed booted from the NVMe disk and mounted its root partition:

$ lsblk
nvme0n1     259:0    0 465.8G  0 disk
|-nvme0n1p1 259:1    0   512M  0 part /boot/firmware
`-nvme0n1p2 259:2    0 465.3G  0 part /

To make sure that no one would be able to use password-based SSH authentication I deleted the user’s password:

$ sudo passwd -d embik

Two last things were necessary to prepare the Pi for Kubernetes: Disabling swap and enabling the memory group. The Raspberry Pi OS seems to have some special swapfile generation (swap isn’t mounted in /etc/fstab as usual), so this seems to be the way to disable swap on next boot:

$ systemctl disable dphys-swapfile.service

By default Raspberry Pi OS doesn’t enable the memory cgroup, which is a hard requirement for Kubernetes. That can be adjusted in /boot/firmware/cmdline.txt by appending two additional boot parameters (requires a reboot):

cgroup_enable=memory cgroup_memory=1

Rinse and repeat two more times to get all three Pis set up correctly.

Next up

Hardware is all set up now! The next post will discuss setting up Kubernetes on these Raspberry Pis with KubeOne and keepalived. Stay tuned and subscribe to my blog via RSS to not miss any upcoming posts.

Sources

Nine Kubernetes Tools You Might Not Know

Marvin Beckers

January 27, 2024

Categorized as kubernetes

Everyone working with Kubernetes (mostly likely) has kubectl installed. Most people also have helm. But what other tools are out there for your daily work with Kubernetes and containers? This post explores a couple of projects that range from somewhat known to heavily obscure, but all of them are part of my daily workflows and are my recommendations to aspiring (and seasoned) Kubernetes professionals.

Let’s dive right into our list!

protokol

This one takes the cake as “most obscure” because I am the only person who has starred it on GitHub at the time of writing this. People are seriously missing out.

protokol is a small tool by my friend Christoph (also known as xrstf) that allows you to easily dump Kubernetes pod logs to disk for later analysis. This is especially useful in environments that do not have a logging stack set up that you can query later on. For example, to get all logs from the kube-system namespace until you stop the protokol command (e.g. with Ctrl+C), run:

$ protokol -n kube-system
INFO[Sat, 27 Jan 2024 11:51:47 CET] Storing logs on disk.                         directory=protokol-2024.01.27T11.51.47
INFO[Sat, 27 Jan 2024 11:51:47 CET] Starting to collect logs…                     container=coredns namespace=kube-system pod=coredns-787d4945fb-4q7jv
INFO[Sat, 27 Jan 2024 11:51:47 CET] Starting to collect logs…                     container=coredns namespace=kube-system pod=coredns-787d4945fb-ghskz
INFO[Sat, 27 Jan 2024 11:51:47 CET] Starting to collect logs…                     container=etcd namespace=kube-system pod=etcd-lima-k8s
INFO[Sat, 27 Jan 2024 11:51:47 CET] Starting to collect logs…                     container=kube-controller-manager namespace=kube-system pod=kube-controller-manager-lima-k8s
INFO[Sat, 27 Jan 2024 11:51:47 CET] Starting to collect logs…                     container=kube-proxy namespace=kube-system pod=kube-proxy-rppbc
INFO[Sat, 27 Jan 2024 11:51:47 CET] Starting to collect logs…                     container=kube-scheduler namespace=kube-system pod=kube-scheduler-lima-k8s
INFO[Sat, 27 Jan 2024 11:51:47 CET] Starting to collect logs…                     container=kube-apiserver namespace=kube-system pod=kube-apiserver-lima-k8s
^C
$ tree
.
└── protokol-2024.01.27T11.51.47
    └── kube-system
        ├── coredns-787d4945fb-4q7jv_coredns_008.log
        ├── coredns-787d4945fb-ghskz_coredns_008.log
        ├── etcd-lima-k8s_etcd_008.log
        ├── kube-apiserver-lima-k8s_kube-apiserver_006.log
        ├── kube-controller-manager-lima-k8s_kube-controller-manager_010.log
        ├── kube-proxy-rppbc_kube-proxy_008.log
        └── kube-scheduler-lima-k8s_kube-scheduler_010.log

3 directories, 7 files

protokol comes with a huge set of flags to alter behaviour and to target specific namespaces or pods. It is really useful in troubleshooting situations where you want to grab large parts of the cluster’s current logs, e.g. to grep for certain things. It’s also quite nice in CI/CD systems where logs of pods should be downloaded as artifacts that will be stored alongside the pipeline results.

Tanka

Do you remember ksonnet? No? A lot of people probably don’t. The ksonnet/ksonnet repository was archived in September 2020, which feels like a lifetime ago. ksonnet used to provide Kubernetes-specific tooling based on the jsonnet configuration language, which is basically a way to template and composite JSON data. The generated JSON structures can be Kubernetes objects, which can be converted to YAML or sent to the Kubernetes API directly. In essence, this was an alternative way to distribute your Kubernetes manifests with configuration options.

ksonnet ceased development but Grafana decided to revive the idea with tanka, which was really nice. The unfortunate truth is that jsonnet is very niche, so niche that the syntax highlighting for my blog doesn’t even support it. The only major project outside of Grafana that seems to use jsonnet is kube-prometheus (which doesn’t use tanka, unfortunately).

I personally find the syntax of it great though, much better than Helm doing string templating on YAML. See below for a jsonnet snippet that generates a full Deployment object:

local k = import "k.libsonnet";

{
    grafana: k.apps.v1.deployment.new(
        name="grafana",
        replicas=1,
        containers=[k.core.v1.container.new(
            name="grafana",
            image="grafana/grafana",
        )]
    )
}

You might feel some resistance to introducing tanka to your workplace because it has a learning curve, but once it clicks you never want to go back to helm. If you get buy-in from your colleagues this might be a huge win – The ability to provide standardized libraries to generate manifests can be extremely helpful in providing a consistent baseline to teams. So it might be worth trying it out for your next project.

stalk

Another tool made by xrstf! stalk allows you to observe the changes in Kubernetes resources over time. This can be very useful if you just can’t understand what is happening to your Deployment (or any other resource) if you struggle to observe changes when running kubectl get. Usually, this is most needed when your Kubernetes controller goes into a reconciling loop. stalk to the rescue - it will show diff formatted output with timestamps when changes happen.

In the example below, the observed changes are limited to the .spec field of a Deployment. So stalk will start by showing .spec at start time, and then log any changes it observes over time (in the example, the Deployment has been scaled down to one replica later on):

$ stalk deployment sample-app -s spec
--- (none)
+++ Deployment default/sample-app v371701 (2024-01-27T12:43:10+01:00) (gen. 2)
@@ -0 +1,30 @@
+spec:
+  progressDeadlineSeconds: 600
+  replicas: 2
+  revisionHistoryLimit: 10
+  selector:
+    matchLabels:
+      app: sample-app
+  strategy:
+    rollingUpdate:
+      maxSurge: 25%
+      maxUnavailable: 25%
+    type: RollingUpdate
+  template:
+    metadata:
+      creationTimestamp: null
+      labels:
+        app: sample-app
+    spec:
+      containers:
+      - image: quay.io/embik/sample-app:latest-arm
+        imagePullPolicy: IfNotPresent
+        name: sample-app
+        resources: {}
+        terminationMessagePath: /dev/termination-log
+        terminationMessagePolicy: File
+      dnsPolicy: ClusterFirst
+      restartPolicy: Always
+      schedulerName: default-scheduler
+      securityContext: {}
+      terminationGracePeriodSeconds: 30

--- Deployment default/sample-app v371701 (2024-01-27T12:43:10+01:00) (gen. 2)
+++ Deployment default/sample-app v371736 (2024-01-27T12:43:13+01:00) (gen. 3)
@@ -1,6 +1,6 @@
 spec:
   progressDeadlineSeconds: 600
-  replicas: 2
+  replicas: 1
   revisionHistoryLimit: 10
   selector:
     matchLabels:

No more head scratching when two controllers compete on specific fields and update them several times a second.

Inspektor Gadget

If the tools in this blog form a toolbox, Inspektor Gadget is the toolbox in the toolbox. For someone with a sysadmin background (like me) this is a treasure trove when troubleshooting low-level issues. The various small tools in Inspektor Gadget are called – unsurprisingly – gadgets and are based on eBPF. You can even write your own gadgets!

Inspektor Gadget consists of a client component (which is a kubectl plugin) and a server component, which runs as DaemonSet on each Kubernetes node (after installing it).

In its essence gadgets give you access to system data you could also fetch from a Kubernetes node’s shell via SSH, but Inspektor Gadget allows to fetch and process this data with the context of containers and across nodes. To just show two of the many available gadgets, below is a snapshot of active sockets in all pods in the current namespace (which usually would be much more):

$ kubectl gadget snapshot socket
K8S.NODE                 K8S.NAMESPACE            K8S.POD                  PROTOCOL SRC                            DST                            STATUS
lima-k8s                 default                  sample-app-6…bf695-4cv89 TCP      r/:::8080                      r/:::0                         LISTEN

The tracing gadgets are also amazing to understand what is actually happening in pods over time. If you want to see which DNS requests and responses happen, you can just use the trace dns gadget:

$ kubectl gadget trace dns
K8S.NODE             K8S.NAMESPACE        K8S.POD              PID         TID         COMM       QR TYPE      QTYPE      NAME                RCODE      NUMA…
lima-k8s             default              sample-app…695-4cv89 98533       98533       ping       Q  OUTGOING  A          google.com.                    0
lima-k8s             default              sample-app…695-4cv89 98533       98533       ping       Q  OUTGOING  AAAA       google.com.                    0
lima-k8s             default              sample-app…695-4cv89 98533       98533       ping       R  HOST      A          google.com.         NoError    1
lima-k8s             default              sample-app…695-4cv89 98533       98533       ping       R  HOST      AAAA       google.com.         NoError    0

Seriously, it’s impossible to overstate how much information in an ongoing incident or a situational analysis can be discovered with Inspektor Gadget. If you operate Kubernetes clusters it should be in your go-to toolbox.

skopeo

This one has the most GitHub stars on the list so it is statistically the tool most people are familiar with, but it still made sense to include it on the list due to its sheer usefulness.

skopeo is strictly speaking not a tool for Kubernetes either – it’s for interacting with container images without the need for a fully blown container runtime running (which is extremely useful on systems that don’t run docker natively, like macOS or Windows). It can assist in both discovering image metadata or manipulating images in various ways.

The two frequent options in daily workflows are likely skopeo copy and skopeo inspect. Here’s an example of inspecting the metadata of an image in a remote registry:

$ skopeo inspect docker://quay.io/embik/sample-app:v0.1.0
{
    "Name": "quay.io/embik/sample-app",
    "Digest": "sha256:efbbf29b92bd8fca3e751c1070ba5bf0f2af31983bfc9b007c7bf26681c59b4c",
    "RepoTags": [
        "v0.1.0"
    ],
    "Created": "2023-04-07T11:38:28.791201794Z",
    "DockerVersion": "",
    "Labels": {
        "maintainer": "marvin@kubermatic.com"
    },
    "Architecture": "amd64",
    "Os": "linux",
    "Layers": [
        "sha256:91d30c5bc19582de1415b18f1ec5bcbf52a558b62cf6cc201c9669df9f748c22",
        "sha256:565a1b6d716dd3c4fdf123298b33e1b3e87525cff1bdb0da54c47f70cb427727"
    ],
    "LayersData": [
        {
            "MIMEType": "application/vnd.oci.image.layer.v1.tar+gzip",
            "Digest": "sha256:91d30c5bc19582de1415b18f1ec5bcbf52a558b62cf6cc201c9669df9f748c22",
            "Size": 2807803,
            "Annotations": null
        },
        {
            "MIMEType": "application/vnd.oci.image.layer.v1.tar+gzip",
            "Digest": "sha256:565a1b6d716dd3c4fdf123298b33e1b3e87525cff1bdb0da54c47f70cb427727",
            "Size": 3189012,
            "Annotations": null
        }
    ],
    "Env": [
        "PATH=/usr/local/sbin:/usr/local/bin:/usr/sbin:/usr/bin:/sbin:/bin"
    ]
}

fubectl

fubectl is a collection of handy aliases for your shell so you don’t have to type out kubectl commands all the time. While this is a project hosted by my current employer, I’ve been using it since before joining Kubermatic.

fubectl is a bit hard to show off in a blog post – the repository README does a much better job at that. Besides the obvious aliases (k instead of kubectl, kall instead of kubectl get pods -A, etc) it does a great job at integrating fuzzy finding via fzf. It makes interacting with Kubernetes much more interactive.

It is much easier to get logs for a pod by running klog and then searching for the pod by typing fragments of its name, and then going through the second stage of selecting the right container within that pod. In a similar fashion, kcns and kcs help switching between contexts and namespaces without much friction.

Once the various aliases of fubectl are in your muscle memory, you can never got back to running kubectl config get-contexts and kubectl config use-context <context> instead of kcs.

kube-api.ninja

This completes the xrstf trifecta of Kubernetes tools you should know about. The difference to all other tools on this list is that this is not a command line tool but a website. It tracks Kubernetes API changes over time in an easy to read table view.

When was a specific resource in a specific API version added to Kubernetes? When was it migrated to another API version? What important API changes are in a specific Kubernetes version (e.g. what APIs might need to be updated in your manifests before upgrading to this Kubernetes version)? kube-api.ninja answers all those questions and many more.

For example the notable API changes for Kubernetes 1.29, showing that some resource types got removed with that version:

kube-api.ninja notable changes for Kubernetes 1.29

kube-api.ninja is also helpful if you are interested in the evolution of APIs. Did you know that HorizontalPodAutoscalers existed as a resource type before Deployments? These days the Kubernetes APIs have stabilized a bit, but I wish I had this around during the extensions to apps migration days.

kubeconform

The last (serious) entry on this list is kubeconform, which is extremely helpful in validating your Kubernetes manifests before applying them. It works great in tandem with helm by first rendering your Helm chart into YAML and then passing that to kubeconform to check for semantic correctness. This is how a simple CI pipeline will much improve your Helm chart’s development process:

helm template \
  --debug \
  name path/to/helm/chart | tee bundle.yaml
# run kubeconform on template output to validate Kubernetes resources.
# the external schema-location allows us to validate resources for
# common CRDs (e.g. cert-manager resources).
kubeconform \
  -schema-location default \
  -schema-location 'https://raw.githubusercontent.com/datreeio/CRDs-catalog/main/{{.Group}}/{{.ResourceKind}}_{{.ResourceAPIVersion}}.json' \
  -strict \
  -summary \
  bundle.yaml

This will help ensure that PRs changing your Helm chart still produce semantically valid Kubernetes resources, not just valid YAML.

kubeconfig-bikeshed

Okay, okay, okay. This one is shameless self-promotion, so I’ll keep it short. If you struggle with juggling access to many Kubernetes clusters and you feel like multiple contexts in your kubeconfig no longer cut it, kubeconfig-bikeshed (kbs) might be for you. I’ve started writing it to replace my various shell snippets that I was using to manage access to Kubernetes clusters.

How many of the listed tools did you know already? Hopefully you found some new things to try out in your next troubleshooting session or CI/CD pipeline design.